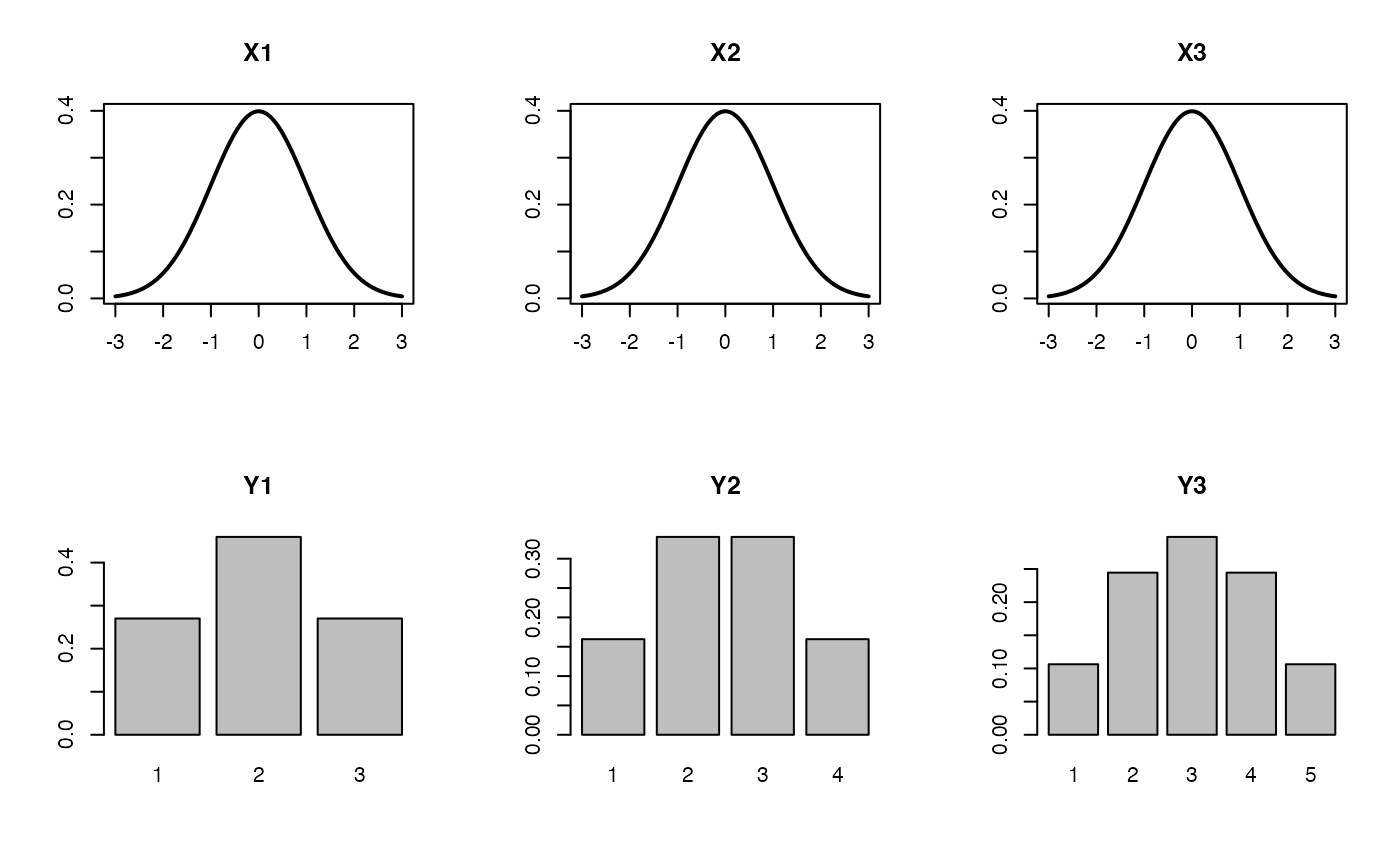
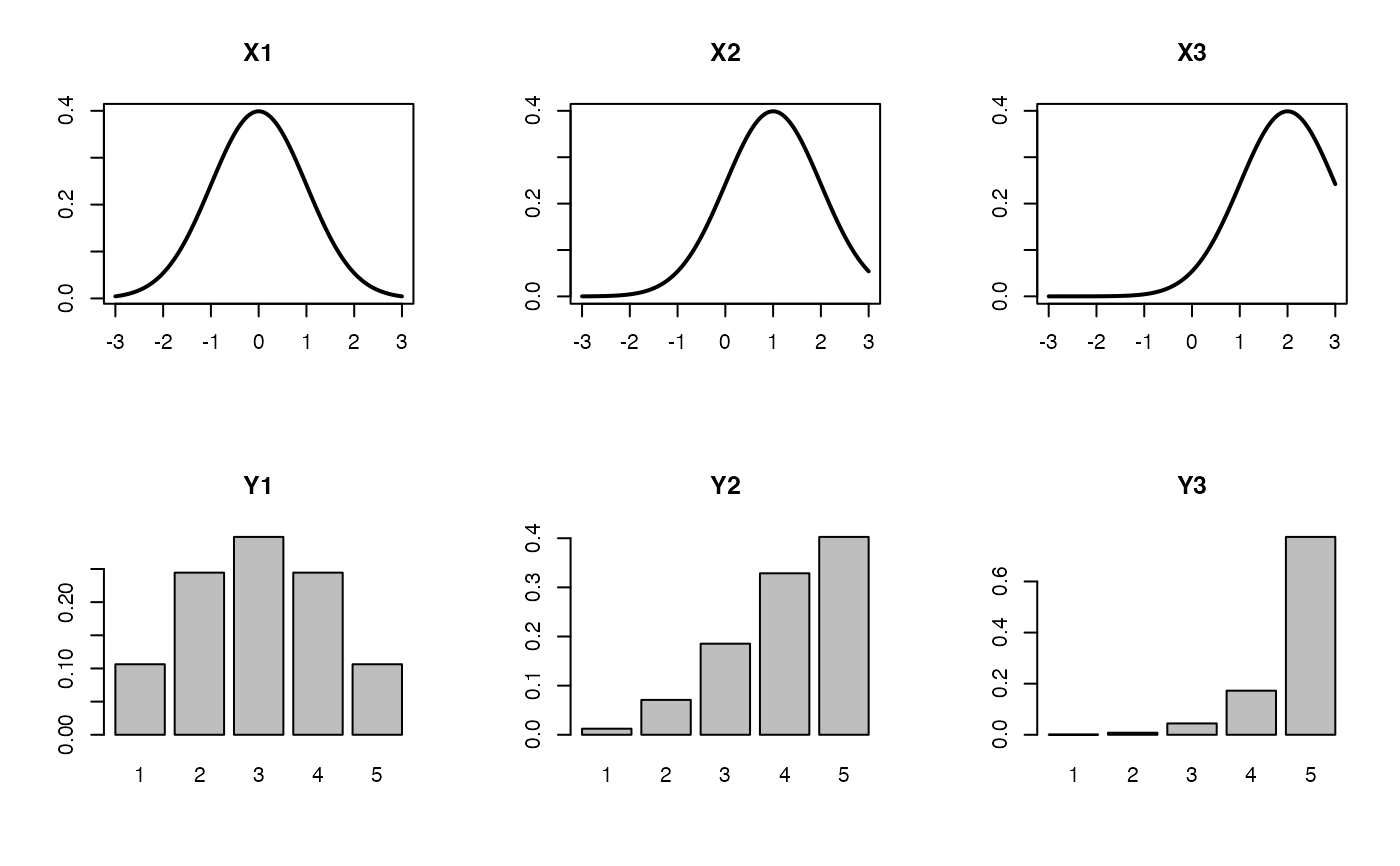
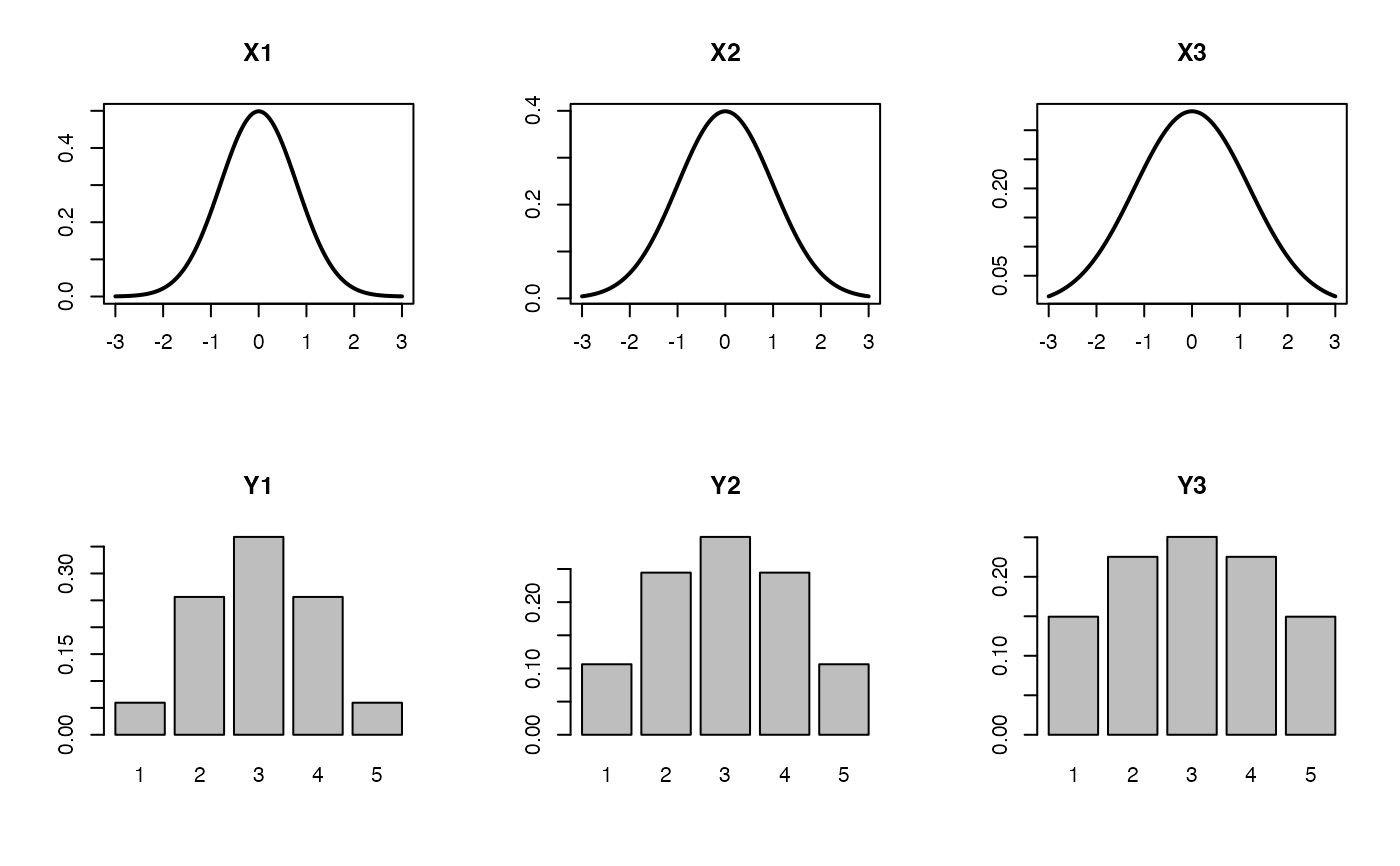
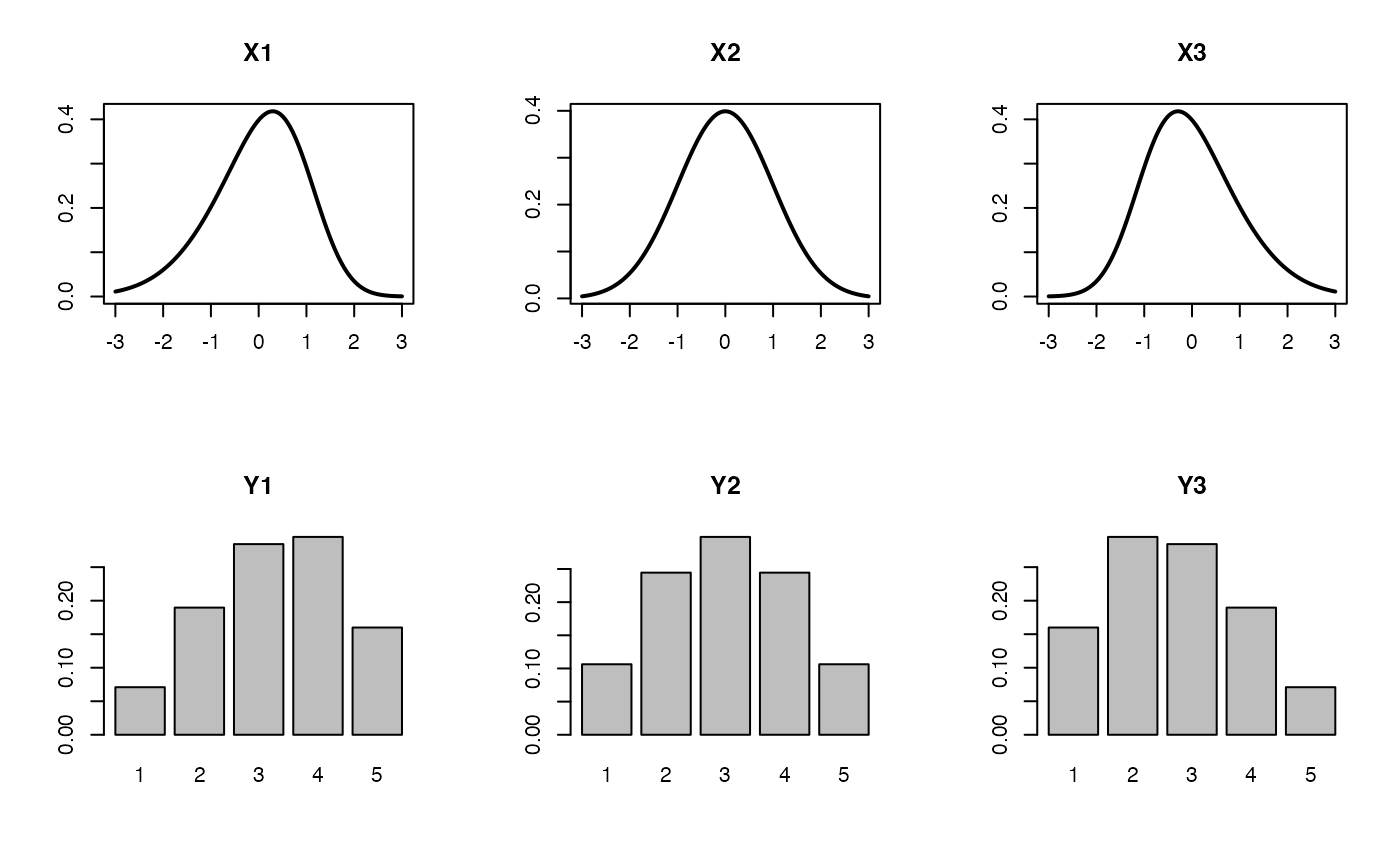
Plots the densities of latent variables and the corresponding transformed discrete probability distributions.
Arguments
- n_items
number of Likert scale items (questions).
- n_levels
number of response categories for each Likert item. Integer or vector of integers.
- mean
means of the latent variables. Numeric or vector of numerics. Defaults to 0.
- sd
standard deviations of the latent variables. Numeric or vector of numerics. Defaults to 1.
- skew
marginal skewness of the latent variables. Numeric or vector of numerics. Defaults to 0.


